Tired of pouring money into marketing without knowing what's actually working? It's a common frustration. You're busy running campaigns across different channels—SEO, paid ads, social media—but when it comes to proving their value, it feels like guesswork.
This guide is your blueprint for moving past that uncertainty. We'll walk through a clear, five-part framework that connects every marketing action directly to business results. It’s about ditching vanity metrics like 'likes' and 'impressions' and focusing on the numbers that really matter.
The goal? To turn your marketing from a cost center into a predictable growth engine. You'll learn how to confidently answer questions about which channels are delivering real value and which are just draining your budget.
Your Blueprint for Measuring Marketing Success
Transforming your marketing strategy starts with a simple, unified approach. It’s about linking the day-to-day tactical work to the high-level outcomes your leadership team actually cares about, like Customer Acquisition Cost (CAC) and Return on Ad Spend (ROAS). Making this shift is what gets you budget approval and proves marketing’s true impact on the bottom line.
To get there, you need a solid structure.
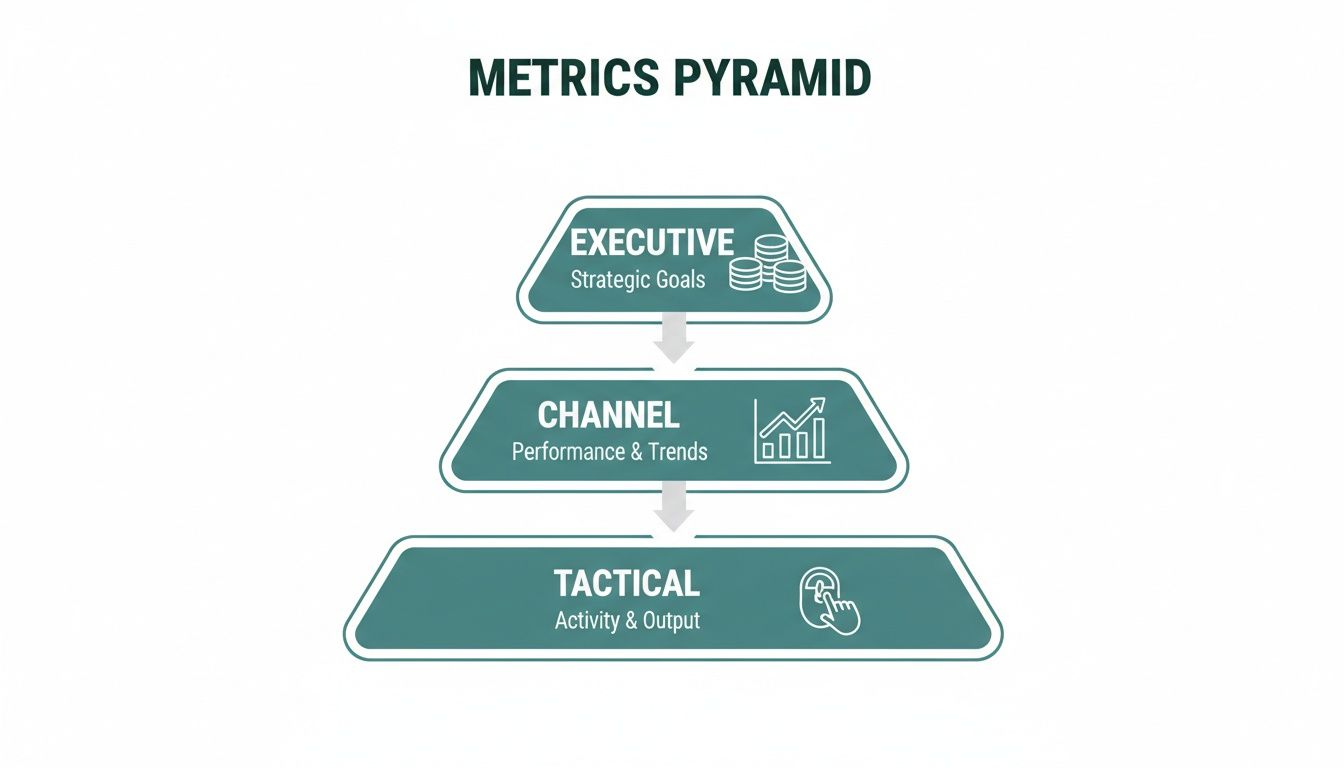
Adopting the Metrics Pyramid
I've found the "Metrics Pyramid" to be an incredibly effective way to organize everything. It’s a straightforward model that aligns your KPIs into three clear tiers, so everyone from the social media manager to the CEO is on the same page.
Here’s how it breaks down:
- Executive Metrics: These are the big-picture numbers that show business impact. Think overall revenue, ROI, and market share.
- Channel Metrics: This is the middle layer where you track how well specific channels are performing. Conversion rates and attribution are key here.
- Tactical Metrics: At the base, you have the granular data from individual campaigns—things like email open rates or ad click-through rates.
This pyramid structure creates a direct line of sight from the daily activities at the bottom to the strategic goals at the top.
The real power here is clarity. When your team understands how their tactical wins contribute to the company's financial health, everything clicks into place.
This isn’t just theory. Companies that truly master this kind of structured measurement often see a 20-30% higher marketing ROI than those still relying on gut feelings. It’s what earns marketers a strategic seat at the table. For small and mid-sized businesses juggling multiple channels, this model is a game-changer, ensuring everyone is pulling in the same direction toward sustainable growth. We'll dig deeper into how this framework connects marketing directly to revenue as we go.
Before we dive into the specifics of each step, here’s a quick overview of the entire framework.
The Marketing Measurement Framework At a Glance
This table breaks down the five core stages we'll be covering. Think of it as our roadmap for building a measurement system that truly works.
| Framework Stage | Objective | Key Questions to Answer |
|---|---|---|
| 1. Define Objectives | Align marketing efforts with core business goals. | What are our top business priorities? What specific outcomes must marketing achieve to support them? |
| 2. Choose KPIs | Select the right metrics to measure progress for each channel. | Which metrics directly reflect the success of our SEO, paid, and social campaigns? |
| 3. Set Up Tracking | Implement tools to accurately collect and attribute data. | Do we have the right analytics and attribution models in place to capture the full customer journey? |
| 4. Build Dashboards | Visualize data to make insights accessible and actionable. | How can we present our data so that anyone can quickly understand performance and trends? |
| 5. Analyze & Iterate | Use data to make informed decisions and optimize campaigns. | What is the data telling us? Where are the opportunities to improve and what should we stop doing? |
Each stage builds on the last, creating a comprehensive loop that ensures your marketing is always learning, adapting, and—most importantly—delivering results. Let’s get started.
Defining Clear Goals and Choosing the Right KPIs
Trying to measure marketing without clear goals is like starting a road trip with no destination in mind. You'll definitely go somewhere, but you'll have no way of knowing if you've actually arrived. The first, most critical step is to move beyond vague ambitions like "more sales" and lock in specific, measurable objectives that can act as your North Star.
Effective goals aren't just wishes; they're precise instructions. Instead of saying you want to "grow the business," a well-defined goal sounds more like this: "Increase Q3 revenue from our e-commerce store by 15% compared to Q2." That kind of clarity turns measurement from a confusing chore into a straightforward process of checking your progress against a fixed target.

From Business Objectives to Actionable Goals
Every marketing goal you set should flow directly from a larger business objective. If the company’s priority is to increase profitability, a marketing goal shouldn't just be about driving more traffic; it should be about generating profitable traffic. This alignment is what guarantees your marketing efforts are always pushing the entire business in the right direction.
To make this happen, I always fall back on the SMART framework. It’s a classic for a reason.
- Specific: Nail down exactly what you want to achieve.
- Measurable: Define how you'll track progress and know when you've succeeded.
- Achievable: Set a realistic goal based on your resources and current market.
- Relevant: Make sure the goal actually supports your bigger business objectives.
- Time-bound: Give yourself a clear deadline.
This simple framework forces you to think through all the important details, turning a fuzzy idea into a concrete plan of attack.
Real-World Goal Setting Scenarios
Let's see how this works in the real world. Vague goals are easy to come up with, but they're impossible to measure. SMART goals give you a clear finish line.
Scenario 1: An E-commerce Brand
- Vague Goal: "We want to improve our ad performance."
- SMART Goal: "Achieve a minimum 3.5x Return on Ad Spend (ROAS) from our Q4 Meta advertising campaigns, targeting our new product line."
See the difference? This goal is specific (3.5x ROAS, Meta ads, new product line), measurable (ROAS is a hard number), achievable (based on past performance), relevant (it drives profitable sales), and time-bound (Q4).
Scenario 2: A Local Service Business
- Vague Goal: "We need more leads from our website."
- SMART Goal: "Generate 50 new marketing-qualified leads (MQLs) per month through organic search by the end of Q2."
Now the team knows exactly what to shoot for (50 MQLs/month) and where those leads should be coming from (organic search). This gives them a clear target for their SEO efforts. By the way, if you want to dive deeper into that, you can learn more about how to increase organic traffic in our detailed guide.
Selecting KPIs That Truly Matter
Once your goals are locked in, it's time to pick the right Key Performance Indicators (KPIs) to monitor them. A KPI is a measurable value that shows how effectively you're hitting your key objectives. It's so important to distinguish KPIs from simple metrics. While a metric might track an activity (like website visitors), a KPI tracks progress toward an outcome (like the website visitor-to-lead conversion rate).
Pro Tip: Your KPIs should tell a story. If your goal is lead generation, tracking Cost Per Lead (CPL), Lead-to-Customer Conversion Rate, and Customer Acquisition Cost (CAC) together tells a much richer story than looking at any single metric in isolation.
The KPIs you choose will vary a lot depending on the marketing channel and the specific goal you've set. Trying to compare the conversion rate from an email campaign to the engagement rate on a social media post is like comparing apples and oranges. Each channel has a different job to do.
Here’s a quick breakdown of essential KPIs, organized by some common marketing channels:
| Marketing Channel | Primary Goal | Key Performance Indicators (KPIs) to Track |
|---|---|---|
| SEO | Drive Organic Leads | Organic Traffic, Keyword Rankings, Conversion Rate, MQLs |
| Paid Ads (PPC) | Generate Sales | ROAS, Cost Per Acquisition (CPA), Click-Through Rate (CTR) |
| Social Media | Build Community | Engagement Rate, Referral Traffic, Follower Growth Rate |
| Content Marketing | Educate & Convert | Leads Generated, Time on Page, Subscriber Growth, Backlinks |
| Email Marketing | Nurture Leads | Open Rate, Click-Through Rate (CTR), Unsubscribe Rate, Conversions |
When you select the right KPIs, you create a direct line between your day-to-day marketing activities and your most important business goals. This makes sure you’re not just collecting data for the sake of it, but actively using it to guide your strategy and prove that what you're doing is actually working.
Getting Your Tracking and Attribution Right
You can't measure what you don't track. It's as simple as that. Once you know what your goals are, the very next step is to get the technical plumbing in place to capture every click, sign-up, and sale. This isn't just about sticking a bit of code on your website; it's about building a data pipeline you can actually trust.
Without a solid tracking setup, you're just guessing. Sure, you might see revenue coming in, but you’ll have no clue which marketing efforts are responsible. Let’s walk through how to build this foundation, starting with the tools you probably already have.
Nail the Tracking Fundamentals First
For most small and mid-sized businesses, the game-changers are Google Analytics 4 (GA4) and UTM parameters. Getting these two things right is non-negotiable if you want to understand what's actually working.
First up, you need to define conversion events in GA4. A conversion isn't always a sale. It could be any action you deem valuable—someone filling out a contact form, downloading a case study, or booking a demo. You have to explicitly tell GA4 what these actions are by setting them up as conversion events. This is how you show the platform what a "win" looks like for your business.
This is what a standard Google Analytics dashboard looks like, giving you a bird's-eye view of your traffic and engagement.
A high-level view is nice, but the real magic happens when you start tracking the specific conversion events that tie directly back to your business goals.
Next, let's talk about UTM parameters. Think of these as little breadcrumbs you add to the end of your URLs. They tell your analytics tools exactly where your traffic came from. Using them consistently—on every email link, every social media post, every single ad—is the only way to kill the mystery of "dark traffic" and know for sure which channels are pulling their weight.
Here are the essential UTM tags you need to know:
utm_source: The platform sending the traffic, likegoogle,facebook, oractive-campaign.utm_medium: The type of marketing, such ascpc,organic-social, oremail.utm_campaign: The name of your specific campaign, likeq4-holiday-saleorwebinar-launch-2024.
Get in the habit of using these, and your data will become infinitely cleaner and more actionable.
Making Sense of Marketing Attribution Models
Okay, so your tracking is set up. Now for the next big question: when a customer clicks on a Facebook ad, reads a blog post, and then clicks a Google ad before buying, who gets the credit?
That’s where marketing attribution comes in. An attribution model is just a set of rules for assigning credit to the different touchpoints along a customer's journey. The model you choose can completely change the story your data tells you.
Last-Click Attribution: This one is straightforward. It gives 100% of the credit to the final touchpoint before the conversion. It's the default in many platforms because it's simple. If you're an e-commerce store running a 24-hour flash sale, the customer journey is short and impulsive, so last-click can actually be pretty useful.
Data-Driven Attribution (DDA): This is Google's smarter, machine-learning-powered model. It looks at all the different paths customers take—both those who convert and those who don't—to figure out which touchpoints truly made a difference. It then assigns partial credit across the journey, giving you a much more realistic view of what’s influencing behavior.
A B2B company with a six-month sales cycle should never rely on last-click attribution. You'd be giving zero credit to the blog post that first caught their attention or the webinar they attended three months ago. For any business with a considered purchase, a multi-touch model like DDA is essential to see the full picture.
Which Attribution Model is Right for You?
So, how do you pick one? It really boils down to your business model and how long it typically takes for a customer to make a purchase.
| Business Type | Typical Sales Cycle | Recommended Attribution Model | Why It Works |
|---|---|---|---|
| E-commerce Store | Short (Minutes to Days) | Last-Click or Data-Driven | The path to purchase is quick, so the last touchpoint is often the most critical. DDA provides more nuance if you have enough data. |
| B2B SaaS Company | Long (Weeks to Months) | Data-Driven or Linear | The journey is complex and involves many interactions over time. These models ensure early and mid-funnel efforts get the credit they deserve. |
| Local Service Provider | Medium (Days to Weeks) | Data-Driven or Position-Based | This approach values both the first touchpoint (discovery) and the final touchpoint (decision), which mirrors how people find and hire local pros. |
A Glimpse into the Future: Beyond User-Level Tracking
With evolving privacy laws, relying solely on cookie-based, user-level tracking is becoming a shaky strategy. This is where a more holistic approach like Marketing Mix Modeling (MMM) is making a major comeback.
MMM doesn't track individual users. Instead, it uses statistical analysis on aggregated historical data (like channel spend, sales, and even external factors like seasonality) to determine the real-world impact of your marketing efforts.
It's a privacy-friendly way to measure ROI across channels. In fact, a recent study showed that over 61% of marketers are leaning more heavily on MMM to get clearer performance insights. For small businesses, this is a powerful way to understand multi-channel impact without getting bogged down in user-level data. Brands that get MMM right often see a 20-30% boost in marketing ROI. If you're curious about where things are headed, you can explore more marketing effectiveness trends for 2025.
By combining meticulous tracking in GA4 with consistent UTM usage and a thoughtful attribution strategy—while keeping an eye on bigger-picture models like MMM—you'll build a measurement framework that gives you the clarity you need to grow.
Your Dashboard: Turning Raw Data Into a Clear Story
Let's be honest, a spreadsheet filled with endless rows of numbers is where insights go to die. All that valuable data is completely useless unless you can turn it into a clear, visual story—one you can grasp in seconds. This is precisely why building a good marketing dashboard is so crucial. It’s your command center, translating a mess of metrics into real, actionable intelligence.
The whole point is to create a single source of truth. Instead of jumping between five different platforms trying to piece together what’s working, a well-built dashboard brings it all together. It lets you spot trends, flag problems, and make confident decisions about your budget without all the guesswork.
![]()
From Data Points to Visual Insights
Getting started is easier than you might think. For most small and mid-sized businesses, a powerful (and free) tool like Google Looker Studio is the perfect entry point. It connects seamlessly with Google Analytics and Google Ads, and you can pull in data from your social media platforms, too. While you're getting your analytics set up, it's also a great time to check out other free SEO tools to boost your website that can give you even more data to work with.
Once your data sources are connected, the real fun begins: visualization. The chart you choose matters. A lot. Using the right visual for the right data is what makes a dashboard intuitive and genuinely useful.
Here are the workhorses I rely on every day:
- Scorecards: These are for your headline numbers. Think big, bold, can't-miss metrics. I always put Total Revenue, ROAS, or Customer Acquisition Cost (CAC) in scorecards right at the very top.
- Line Charts: Nothing tells a story over time like a line chart. They're my go-to for tracking things like Organic Traffic, Lead Volume, or Ad Spend to see the ebbs and flows.
- Bar Charts: Need to compare things? Use a bar chart. It’s the simplest way to see which marketing channel is bringing in the most conversions or which ad campaign is getting the best click-through rate.
- Tables: When you need the nitty-gritty details, tables are your best friend. They’re perfect for breaking down campaign performance by specific ad groups, keywords, or landing pages.
Designing a Practical Multi-Channel Dashboard
One of the biggest mistakes I see is people trying to cram everything onto one screen. It just creates a cluttered mess that actually hides the important stuff. The best dashboards I've built are organized logically, guiding you from the 30,000-foot view down to the in-the-weeds details.
I like to structure multi-channel dashboards like a three-act story.
- The Executive Summary: Start with a clean, simple section at the top. This is for the big-picture business metrics, displayed in scorecards. It should answer the most important questions in 30 seconds or less: Are we hitting revenue targets? What’s our overall ROAS? Is our CAC heading up or down?
- Website Performance Overview: Next, zoom in on your website—it’s the hub of all your marketing. Use line charts to show traffic trends and bar charts to break down where that traffic is coming from. Essential metrics here are Sessions, Users, Conversion Rate, and Total Conversions.
- Channel-Specific Deep Dives: Finally, give each of your core marketing channels its own dedicated section. For SEO, you’d track organic sessions and keyword rankings. For Google Ads and Meta Ads, you’d be watching Impressions, Clicks, CPA, and ROAS.
By organizing your dashboard this way, you make it useful for everyone. An exec can get the high-level summary they need from the top section, while a marketing manager can scroll down to diagnose exactly what's happening in a specific channel and find opportunities to improve.
This layered approach is what elevates a dashboard from a data-dump into a true decision-making tool. You're no longer just collecting numbers; you're actively using them to understand what’s working and steer your marketing strategy with confidence.
Analyzing Results and Iterating for Growth
Alright, your dashboards are built and the data is flowing in. But this is where the real work begins. Getting the numbers is one thing; turning them into smart decisions is what actually moves the needle. This is how you transform marketing from a list of tasks into a genuine growth engine for your business.
The whole point of a dashboard isn't just to see what happened, but to figure out why. It's about spotting the patterns, asking the tough questions, and forming educated guesses—hypotheses—that you can actually go and test. This cycle of analysis and refinement is what separates the pros from the amateurs.

From Observation to Actionable Insights
Solid analysis often starts with a simple "huh, that's weird." Maybe a metric you watch daily is suddenly off, or a trend is heading in the wrong direction. Your job is to put on your detective hat and uncover the story behind that number.
For example, let's say you notice organic traffic from Google is climbing. That’s great! But then you glance at your lead conversions, and the number is completely flat. This is a classic marketing puzzle you need to solve.
- Observation: Organic traffic is up a healthy 15% this month.
- Contradiction: Total lead conversions haven't budged.
- Next Question: So, where's the disconnect?
This single question forces you to look deeper into the user journey. Are these new visitors landing on pages that actually ask them to do something? Is there a hidden technical bug with your contact form? By asking "why," you shift from just reporting on the past to actively solving problems for the future. It's the same logic you'd apply to video performance, which you can read more about in our guide on how to measure the ROI on marketing videos.
"Advanced analytics truly transform marketing from an art into a science. Firms that rate their measurement capabilities as 'good' have a 50% chance of achieving over 5% revenue growth, compared to just a 5% chance for those with 'poor' measurement. This shift relies on quality data, timely insights, and the ability to connect creative execution to tangible results." – Gain Theory
A Framework for Iteration and Testing
Once you have a hunch, you need to test it. This is the essence of iteration—making small, controlled adjustments to see if you can nudge the numbers in the right direction. If your ad costs are creeping up, for instance, don't panic and throw more money at it. Start A/B testing instead.
You could test different ad images, tweak your headline, or experiment with a new audience segment. The key is to change only one thing at a time. That way, you can scientifically figure out what really resonates and what helps bring your Cost Per Acquisition (CPA) back down to earth.
To make this more concrete, think about the common stories your dashboard might tell you and what your next move should be.
Common Scenarios and Actionable Next Steps
This table breaks down how to translate typical dashboard observations into specific, testable actions you can take right away.
| If You See This Metric… | It Might Mean… | Your Next Action Should Be… |
|---|---|---|
| High organic traffic, low conversions | Your content is great at attracting eyeballs but isn't persuading visitors to act. | Run an A/B test on the call-to-action (CTA) on your top-performing blog posts or landing pages. Try a different button color, text, or offer. |
| Rising ad costs (CPA) | Your audience is getting tired of seeing the same ad (ad fatigue), or your targeting is too broad. | Launch a new set of ad creatives to refresh the campaign. At the same time, try narrowing your audience targeting to a more specific niche. |
| High email open rates, low click-throughs | The subject line grabbed their attention, but the content of the email didn't seal the deal. | Experiment with a different email layout. Test a bolder button design, rewrite the body copy, or simplify the core message. |
This process of observing, hypothesizing, and testing is the heartbeat of effective marketing.
Proving Your Impact with Incrementality Testing
Finally, let’s touch on a more advanced concept: incrementality testing. This is all about proving that your marketing efforts are actually causing sales, not just conveniently being there when a sale happens. It answers the question, "Would we have gotten that sale anyway?"
The most common method here is a holdout test. You essentially take a small slice of your audience and deliberately don't show them a particular ad campaign. If the conversion rate in the group that did see the ad is significantly higher than in your holdout group, you've just proven that ad's incremental value.
This kind of scientific approach is incredibly powerful. It helps you justify every dollar in your budget and ensures you're putting money into activities that genuinely grow the business. It’s how you build a marketing machine that is both repeatable and defensible.
Frequently Asked Questions
Even with the best framework, questions always pop up once you get your hands dirty with marketing data. Here are some of the most common ones I hear, along with some straight-up advice to help you get unstuck.
How Often Should I Review My Marketing Metrics?
There's no single right answer here—it completely depends on what you're looking at. If you try to track high-level ROI every single day, you'll drive yourself crazy reacting to normal fluctuations. But if you only check in on your ad campaigns once a quarter, you might as well just be lighting your money on fire.
A good rhythm looks something like this:
- Daily or Weekly: This is for the tactical stuff. Think Cost Per Acquisition (CPA), ad Click-Through Rates (CTR), and conversion rates on specific landing pages. You need to keep a close eye on these to make quick adjustments and stop wasting budget.
- Weekly or Bi-Weekly: Zoom out just a little bit. Look at channel-level performance like overall website traffic, new leads, and organic search sessions. This cadence helps you spot trends without getting bogged down in daily noise.
- Monthly or Quarterly: Now you're in CEO mode. This is the time to review the big picture metrics that guide your strategy, like Customer Acquisition Cost (CAC), Customer Lifetime Value (CLV), and overall Return on Marketing Investment (ROMI).
What Are the Most Important Metrics for a Small Business?
When you're running a small or mid-sized business, you have to be ruthless with your focus. Brand awareness is great, but cash flow and profit are what keep the doors open. You need metrics that are tied directly to the bottom line.
If you can only track three things, make them these: Customer Acquisition Cost (CAC), Customer Lifetime Value (CLV), and Conversion Rate. These three tell a complete story: what it costs to land a customer, how much that customer is worth over time, and how good you are at turning lookers into buyers.
A healthy business model is all about the relationship between what you spend and what you earn. A fantastic benchmark to aim for is a CLV:CAC ratio of 3:1 or better. This simple ratio gives you a powerful, at-a-glance view of whether your marketing is financially sustainable.
What Tools Do I Need to Start Measuring?
Don't assume you need to drop a ton of cash on a complicated software suite. You can build an incredibly effective measurement system with tools that are completely free.
Here’s the essential starter kit I recommend to everyone:
- Google Analytics 4 (GA4): This is non-negotiable. Get it set up on your website to track traffic, see what users are doing, and, most importantly, track your conversion goals.
- Google Search Console: If organic traffic is part of your plan, this is your direct line to Google. It gives you indispensable insights into how you're performing in search results.
- Google Looker Studio: This is where the magic happens. It’s a powerful, free dashboarding tool that pulls data directly from GA4 and Search Console, letting you visualize everything in one place.
As you grow, you'll eventually want to pull in data from your CRM to see the full customer journey. But these three tools give you more than enough firepower to get started today.
At Danny Avila, we build the dashboards and tracking systems that turn scattered data into clear, actionable growth strategies for businesses in San Diego and beyond. If you're ready to stop guessing and start knowing what your marketing is really doing, let's talk.